
Monitor diagnosis runs
The Runs area is the operator view for advisory diagnosis lifecycle. Its structured activity is not a shell and never accepts arbitrary commands.
- Typical time
- 5–20 minutes plus runner time
- You need
- An accepted diagnosis request or existing run history
- Outcome
- An authoritative terminal run status
Step 1: Find Diagnosis runs
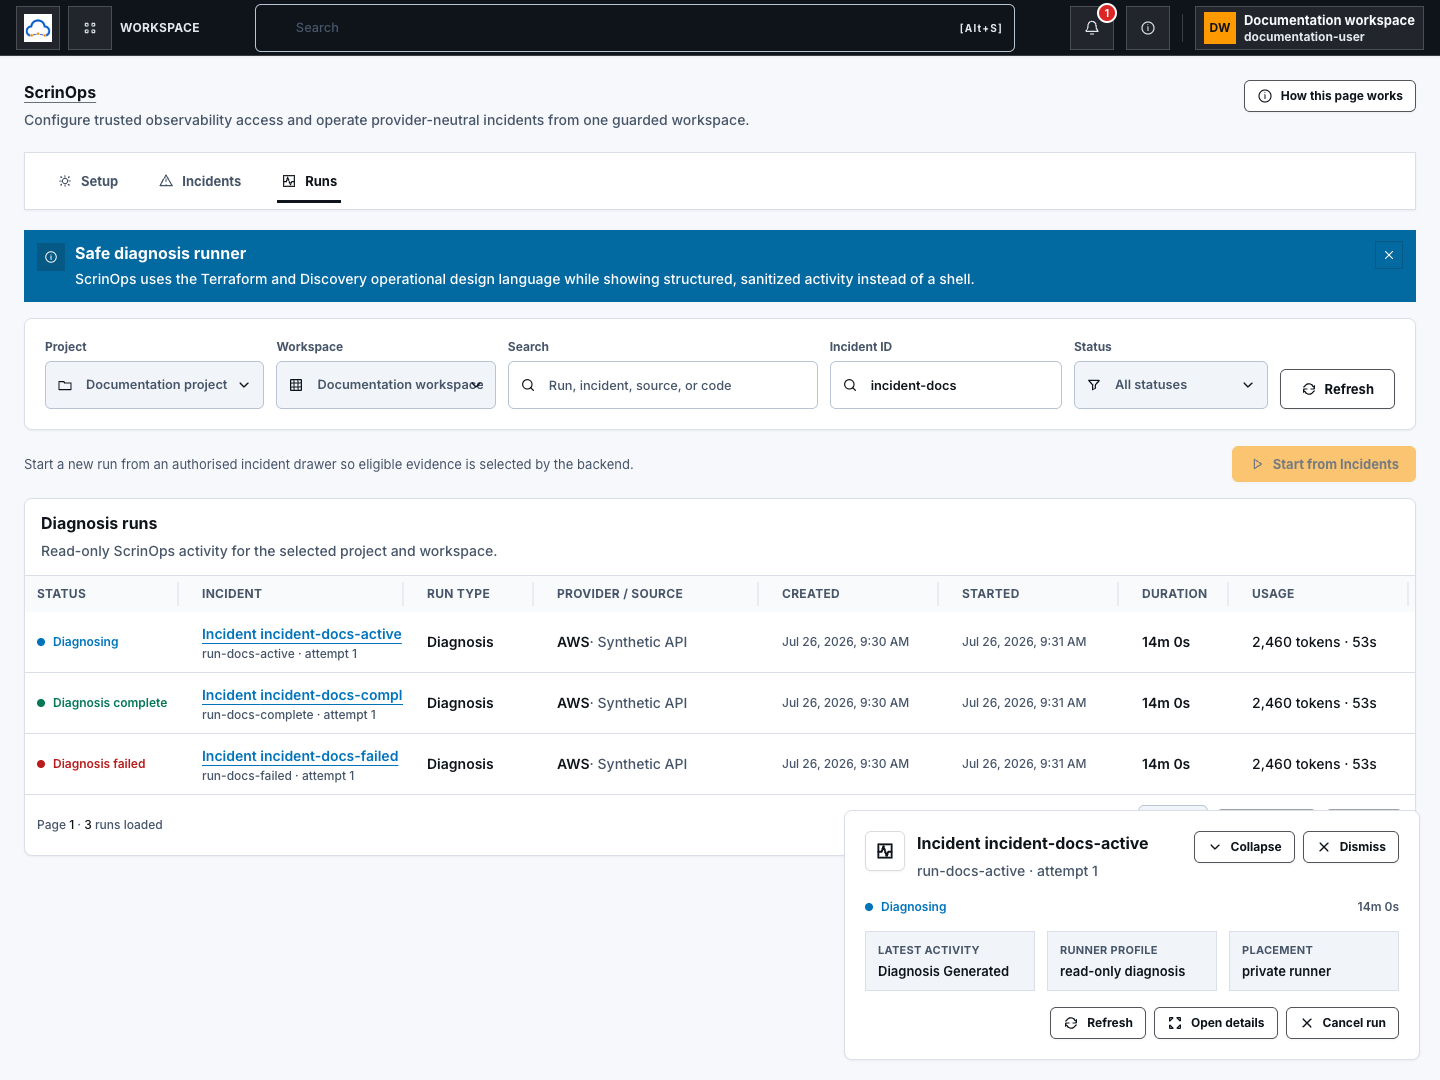
Section titled “Step 1: Find Diagnosis runs”Open Runs and select Project and Workspace. Filter by:
- Search for run, incident, source, or safe code;
- Incident ID when following one incident;
- Status; and
- cursor-based Previous, Next, and page size.
Visible statuses include queued, deferred, starting, running, cancelling, succeeded, failed, cancelled, timed out, and rejected.
Step 2: Follow the active runner dock
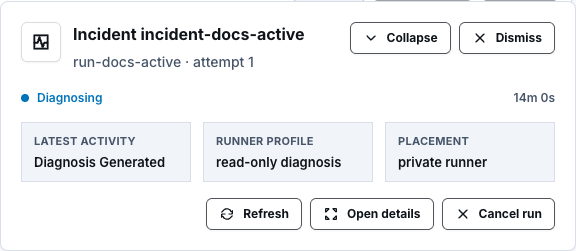
Section titled “Step 2: Follow the active runner dock”After acceptance, the active dock shows incident, run attempt, status, duration, latest activity, backend-selected runner profile and placement, and—when available—queue position and estimated start.
Use Collapse, Expand, Refresh, Open details, or Dismiss. Dismiss closes the dock only; it does not cancel the backend run.
Step 3: Interpret lifecycle correctly
Section titled “Step 3: Interpret lifecycle correctly”| Status | Meaning | Operator response |
|---|---|---|
| Queued | Request is waiting to start | Wait or refresh; do not resubmit |
| Waiting for capacity | Secure runner capacity is full | Leave the run queued |
| Starting secure runner | Backend is launching bounded execution | Monitor |
| Diagnosing | Read-only analysis is active | Review structured activity |
| Stopping | Cancellation was requested | Wait for terminal confirmation |
| Diagnosis complete | Validated diagnosis was stored | Review evidence and hypotheses |
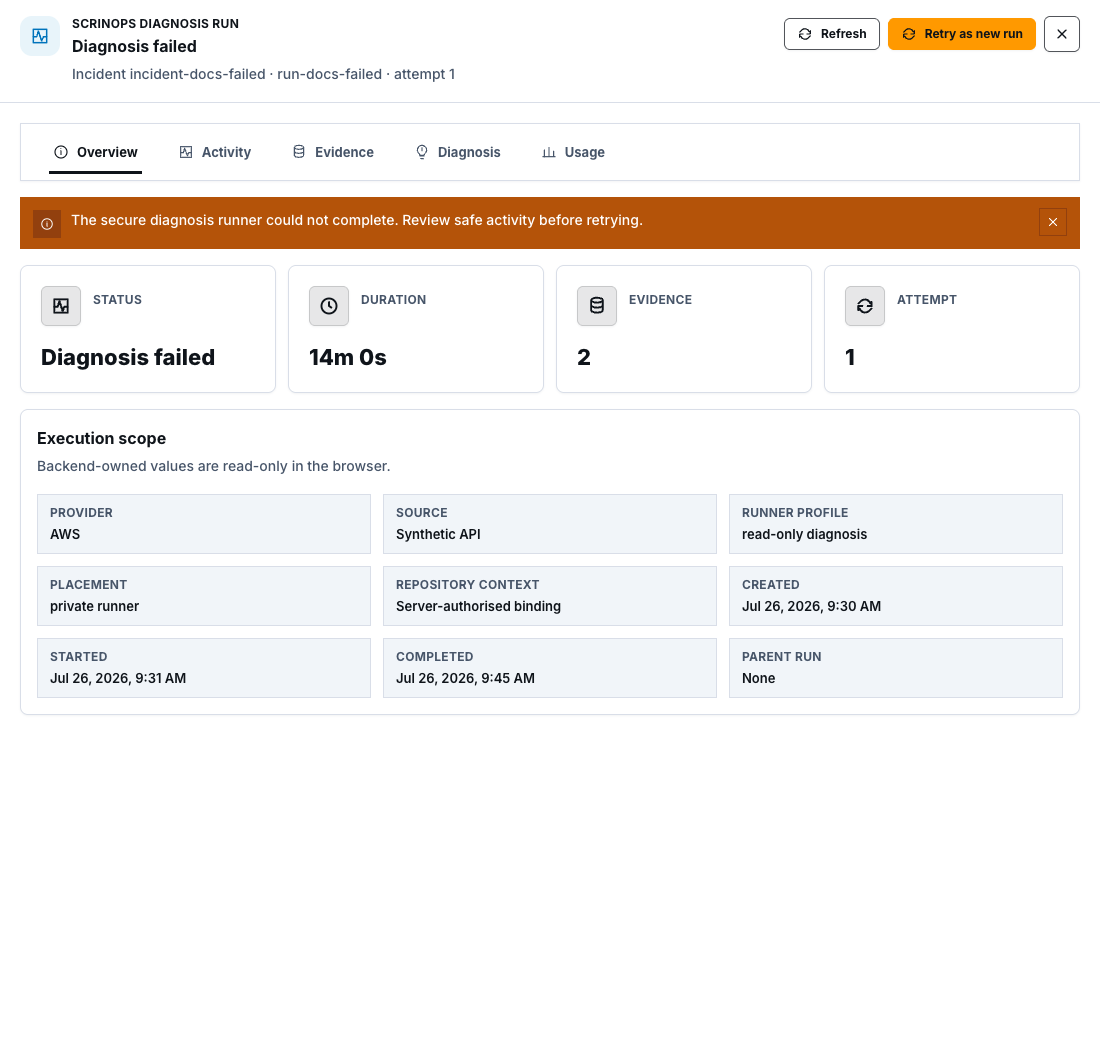
| Diagnosis failed | Runner could not complete | Review safe activity, then retry if eligible |
| Cancelled | Backend confirmed stop | No infrastructure change was made |
| Timed out | Server-managed time limit was reached | Review retained evidence |
| Not authorised | Scope, evidence, entitlement, or policy rejected the run | Correct the gate; do not bypass it |
Step 4: Open run details
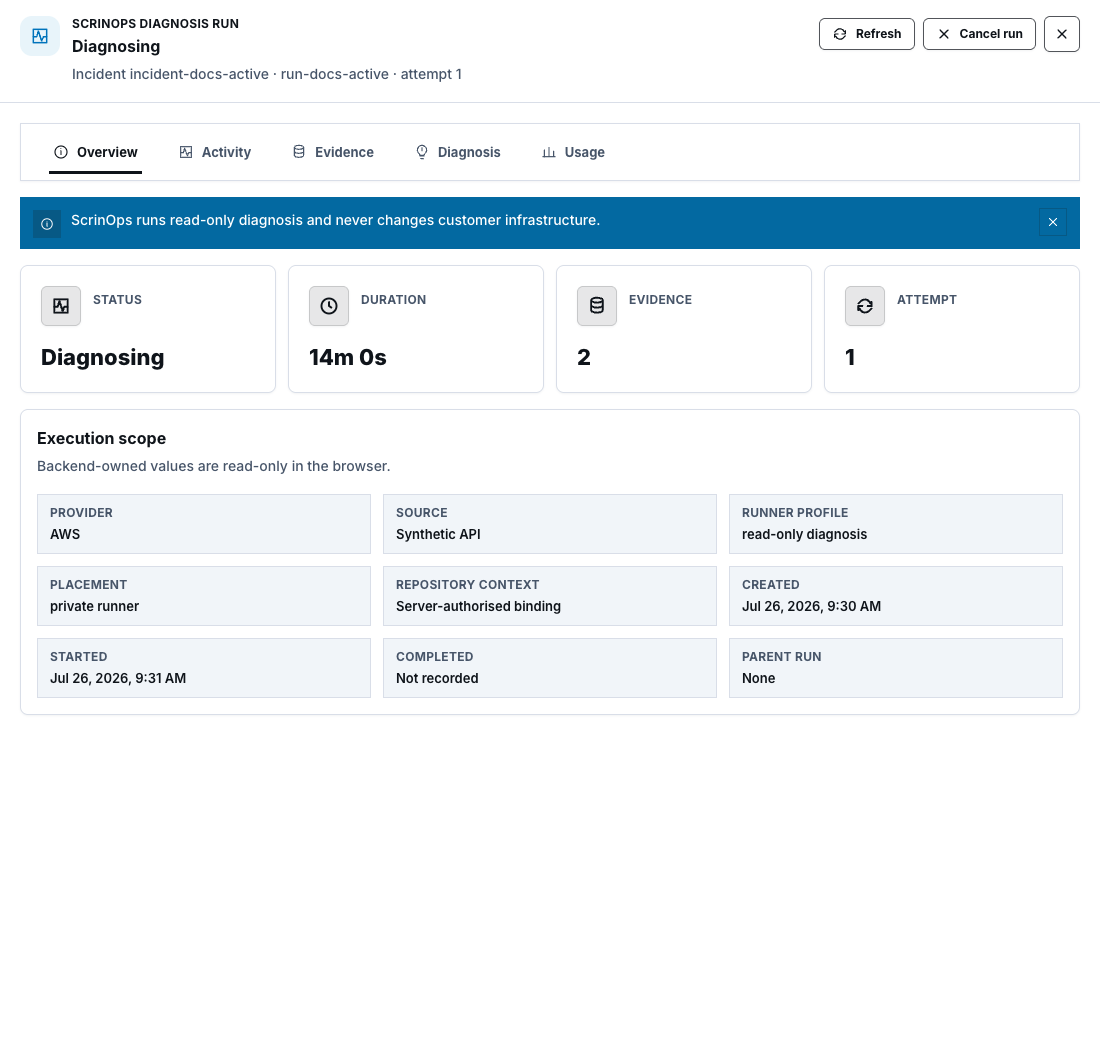
Section titled “Step 4: Open run details”Choose View run or Open details. The drawer provides Overview, Activity, Evidence, Diagnosis, and Usage. It refreshes the authoritative snapshot and incremental structured events while the page is visible.
Step 5: Cancel an active run
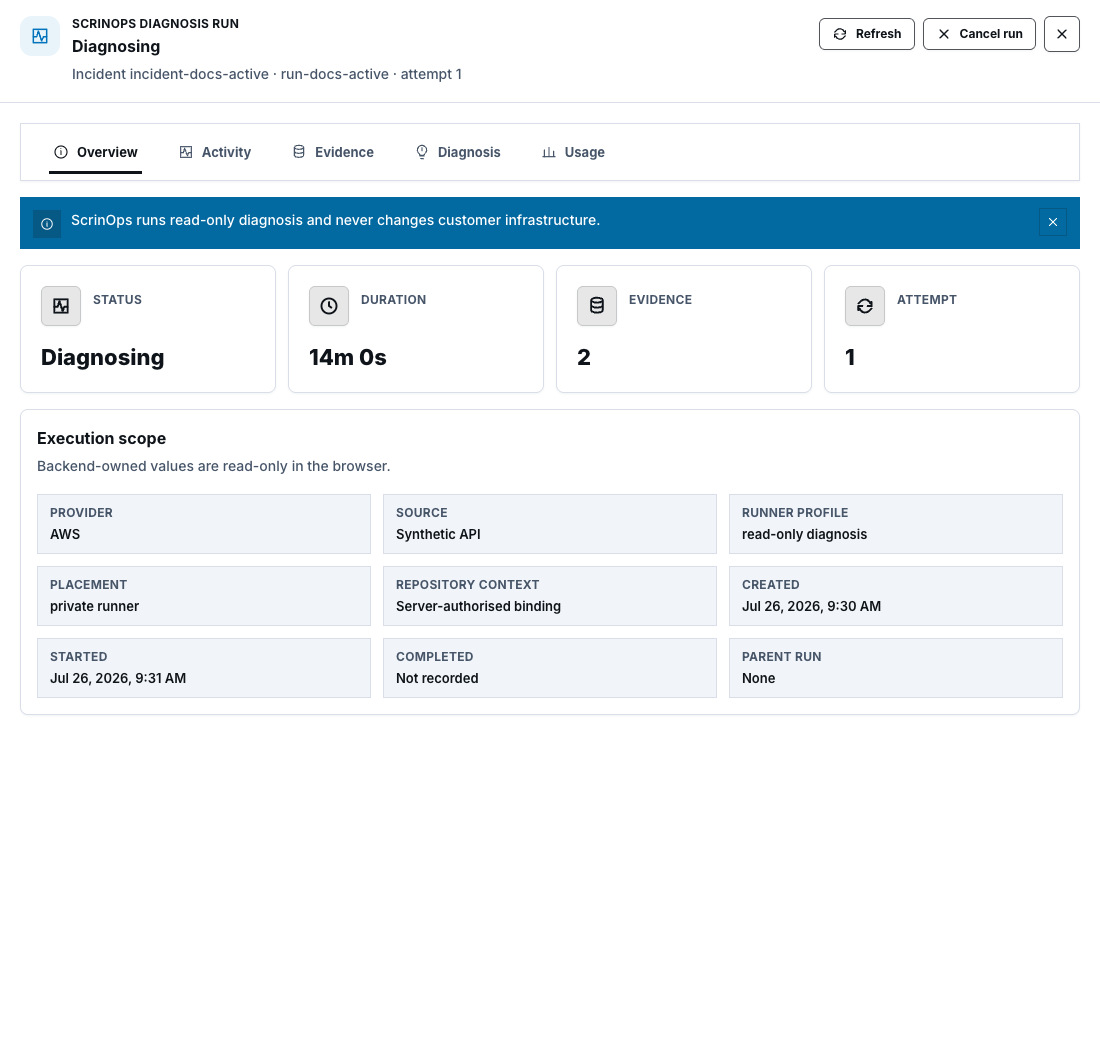
Section titled “Step 5: Cancel an active run”Choose Cancel run only for a non-terminal run. Cancellation is a request. Keep monitoring until the backend confirms Cancelled or another terminal state. Never report the runner stopped based only on the button response.
Step 6: Retry as a new run
Section titled “Step 6: Retry as a new run”Retry as new run appears for failed, cancelled, timed-out, or rejected runs. Retry creates a new child attempt with a new run identity. The original terminal run and evidence remain unchanged.
Check your result
Section titled “Check your result”The run reaches an authoritative terminal state. If it succeeded, diagnosis and usage are available. If it failed, the safe status and activity explain the next permitted action without exposing internals.
Common blockers
Section titled “Common blockers”- Waiting for capacity: leave the accepted run queued.
- Live updates unavailable: refresh; the backend remains authoritative.
- Cancel remains Stopping: wait for terminal reconciliation.
- Retry unavailable: only eligible terminal states can create a new attempt.
- No run history: start from an incident with ready evidence or change the current filters.
- Runtime request unavailable: source wiring is not proof that the deployed end-to-end runner contract is active.