
Review incidents
ScrinOps incidents are provider-neutral summaries for an exact project and workspace. The browser receives redacted metadata, not raw provider alerts, credentials, or log content.
- Typical time
- 10–20 minutes
- You need
- An enabled incident feed in the selected scope
- Outcome
- A triaged incident with evidence readiness understood
Step 1: Choose the incident scope
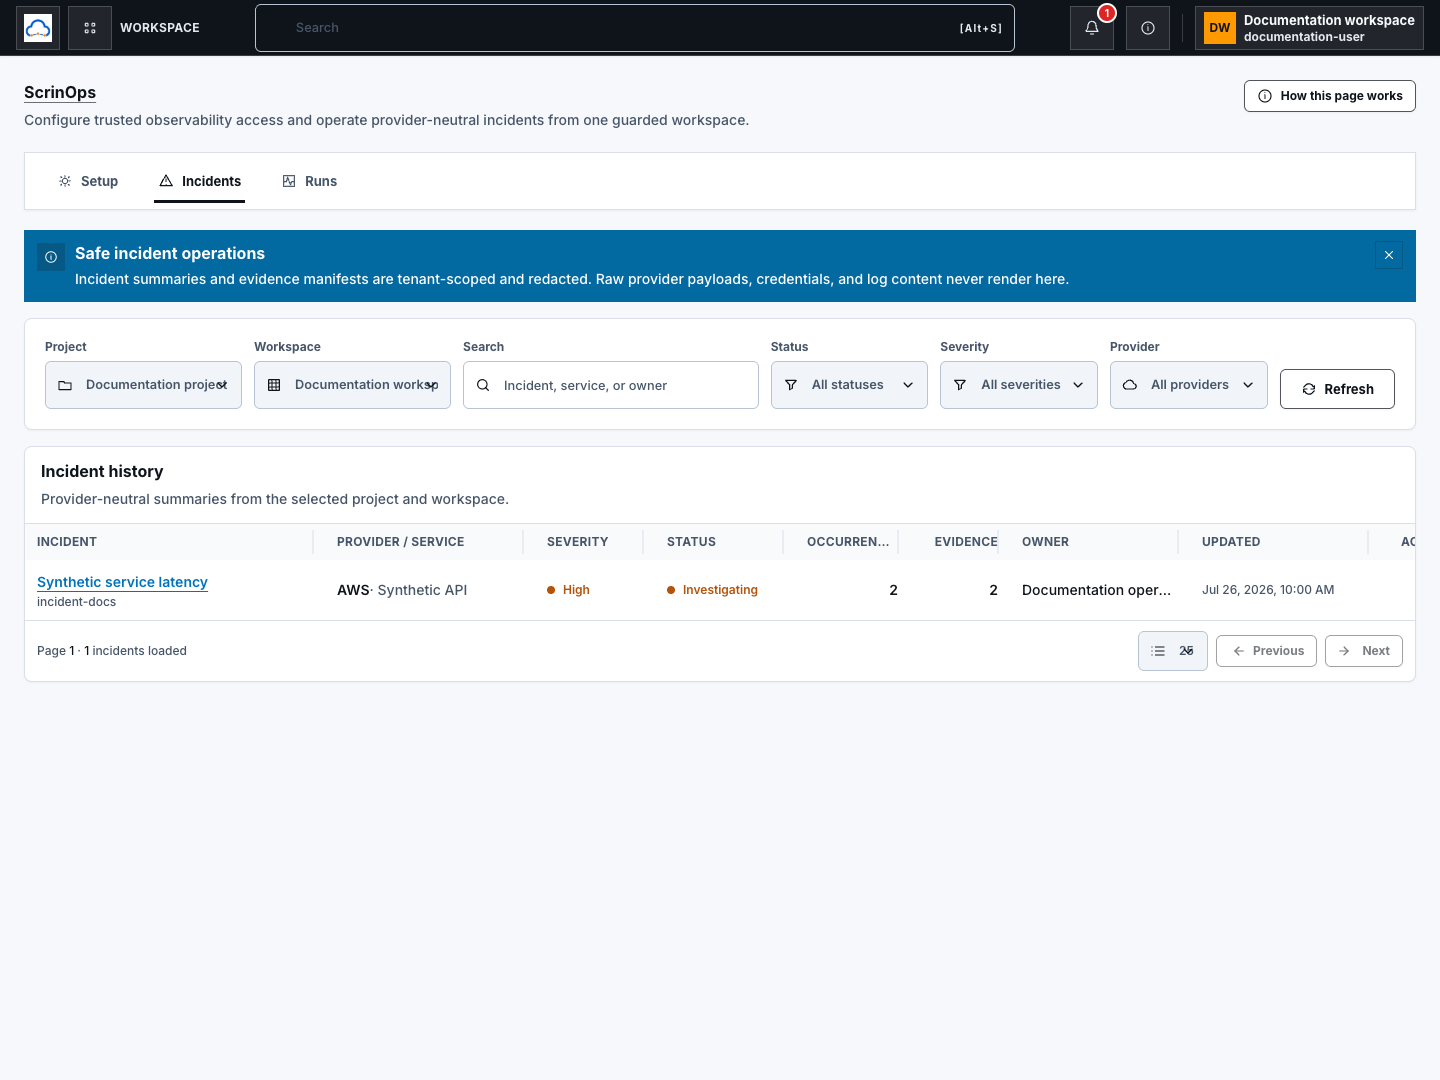
Section titled “Step 1: Choose the incident scope”Open ScrinOps, then Incidents. Select Project and Workspace. Every list, cursor, filter, detail request, and diagnosis action stays bound to that authenticated scope.
Step 2: Filter Incident history
Section titled “Step 2: Filter Incident history”Use:
- Search for an incident, service, or owner;
- Status: All statuses, Open, Investigating, Mitigated, or Resolved;
- Severity: All severities, Critical, High, Warning, or Info;
- Provider: AWS or Azure;
- Refresh for the current page; and
- Previous, Next, and page size for bounded history navigation.
If Partial connector data appears, incident summaries remain available but evidence or work-item data is degraded. Do not interpret partial data as a full incident record.
Step 3: Open View details
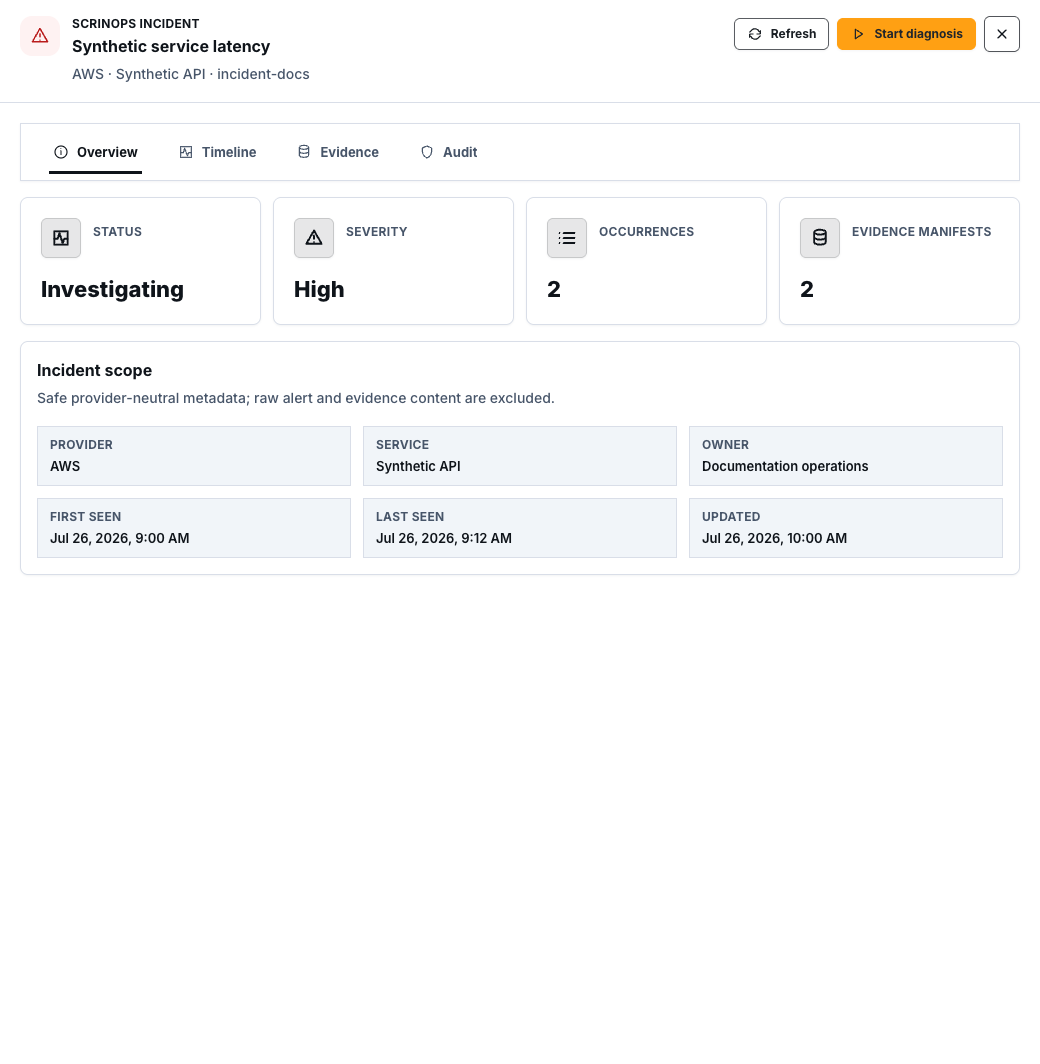
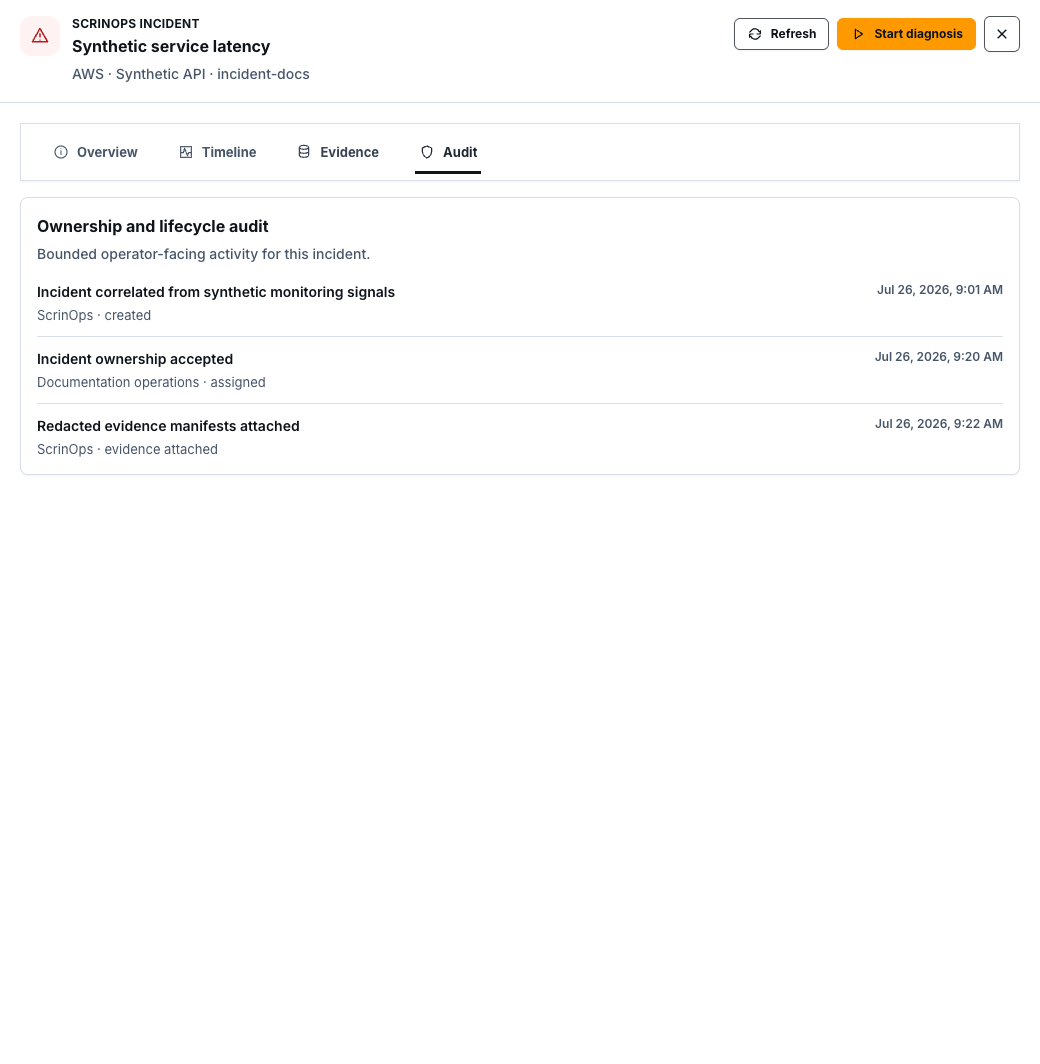
Section titled “Step 3: Open View details”Choose the incident title or View details. The right-side incident drawer contains Overview, Timeline, Evidence, and Audit.
Step 4: Read the Timeline
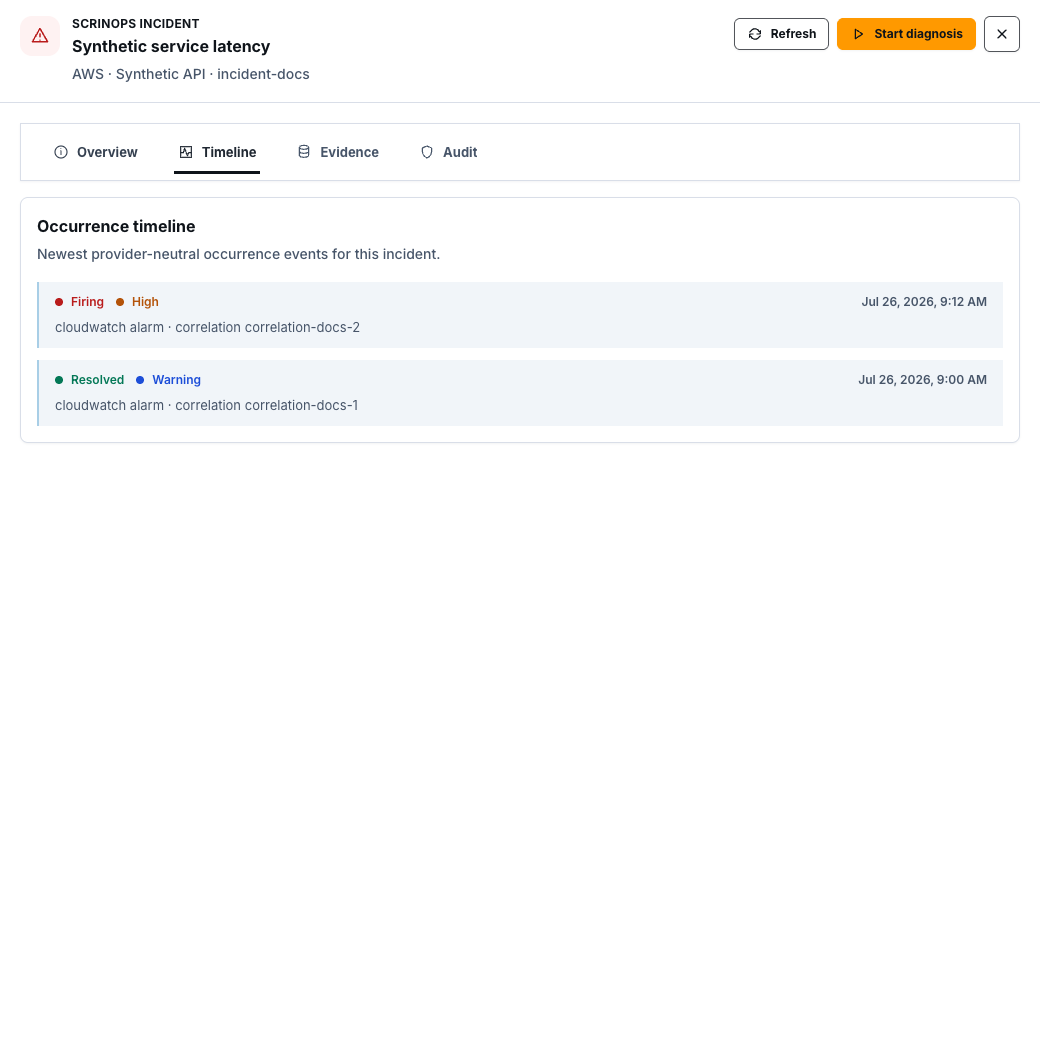
Section titled “Step 4: Read the Timeline”Timeline lists bounded occurrence summaries with firing or resolved state, severity, source kind, time, and correlation reference. It does not expose the raw CloudWatch or Azure Monitor alert body.
Step 5: Assess Evidence
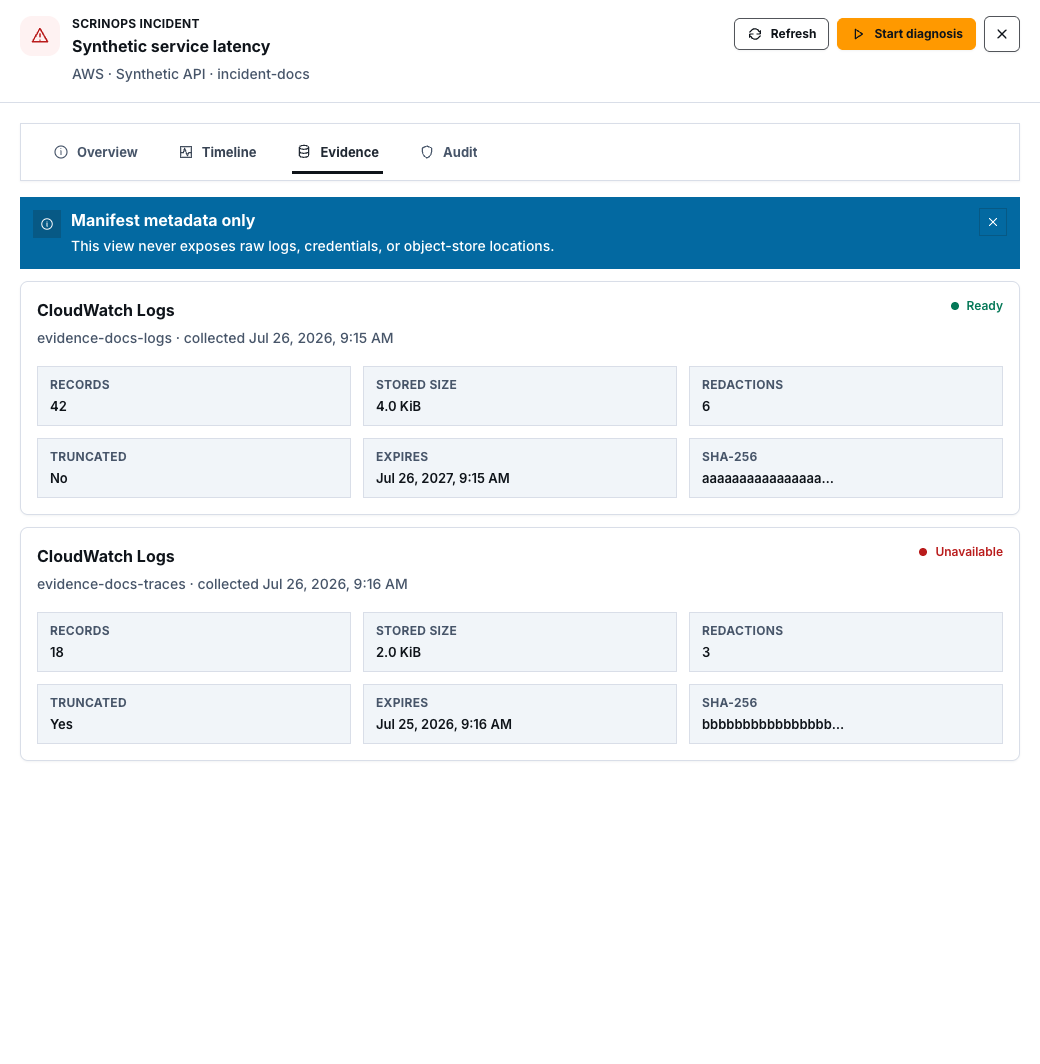
Section titled “Step 5: Assess Evidence”Evidence shows manifest metadata only:
- source kind;
- ready, degraded, or unavailable status;
- record and stored-size counts;
- redaction and truncation state;
- collection and expiry time; and
- a shortened digest.
Only ready, unexpired evidence can make Start diagnosis available.
Step 6: Review Audit
Section titled “Step 6: Review Audit”Audit shows bounded ownership and lifecycle events such as created, assigned, status changed, evidence attached, and diagnosis started.
Check your result
Section titled “Check your result”You understand the incident state, severity, occurrence history, evidence freshness, degraded sources, ownership, and whether diagnosis is eligible.
Common blockers
Section titled “Common blockers”- No incidents found: change filters, confirm scope, and verify live alert ingestion separately.
- Partial connector data: continue only with the available evidence and note the gap.
- Details unavailable: retain the summary and retry; do not infer missing timeline or evidence.
- Diagnosis unavailable: refresh evidence or wait for a ready, unexpired manifest.
- Access denied: request the correct project/workspace permission; do not reuse identifiers from another tenant.